PTS/DTS Analysis
The PTS/DTS Analysis graphs the elementary streams PTS/DTS values against their respective program PCR values.
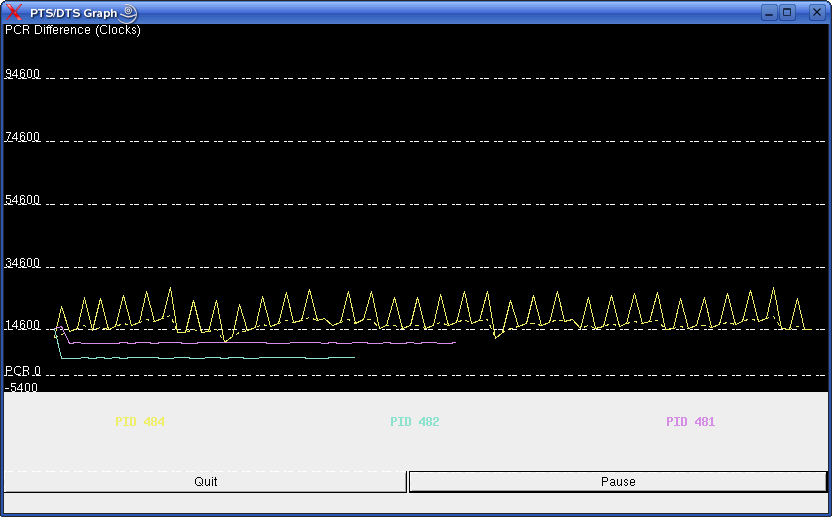
The PTS/DTS values are plotted with each timestamp (as PTS/DTS - PCR) and the difference plotted on the graph. PTS differences are plotted as solid lines, DTS differences as dashed lines.
Graph playback can be controlled via the Pause/Resume button.