PCR Analysis
The PCR Analysis displays the PCR characteristics of all PCR PID streams in the transport.
Before beginning the analysis, you must set some graphing parameter
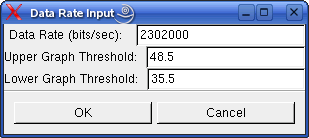
| Data Rate
(bits/sec) |
Transport stream bitrate.
Modify this accordingly |
| Upper Graph
Threshold |
Upper graphing PCR interval (in
milliseconds) |
| Lower Graph
Threshold |
Lower graphing PCR interval (in
millisecons) |
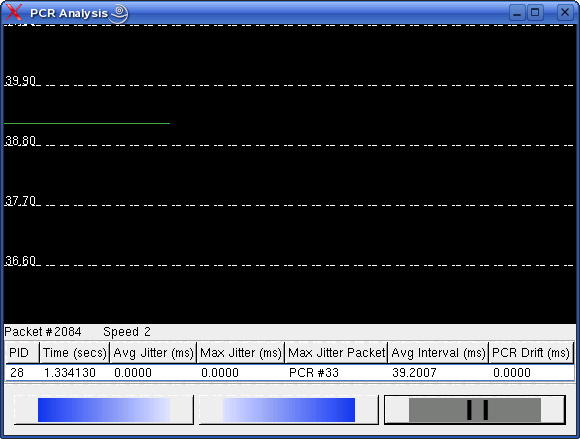
The line graph displays the interval (in msec) between consecutive PCR fields. In the control panel, the first button will increase the analysis speed, the second button will decrease analysis speed, and the third button will toggle the analysis between run/pause.
In addition,
there is a list box below the graph which displays the following
information
| PID |
PID of the stream containing the
PCR |
| Time (secs) |
Transport stream time (based on
the PCR) |
| Avg Jitter |
The average jitter (in
milliseconds) between consecutive PCRs |
| Max Jitter |
The maximum jitter (in
milliseconds) between consecutive PCRs |
| Max Jitter
Packet |
The PCR packet number associated
with 'Max Jitter' column |
| Avg Interval |
The average interval (in
milliseconds) between consecutive PCRs |
| PCR Drift |
The drift (in milliseconds) from
the first PCR. This drift is calculated as PCR(n) - PCR(0) |